Evaluating Urban Canopy's Role in Alleviating Extreme Heat: An i-Tree Cool Air Analysis
Summary of Methods
i-Tree Cool Air
The i-Tree Cool Air model is part of the i-Tree Research Suite of tools. The i-Tree Cool Air model simulates the surface energy and water balance to map the urban heat island phenomenon of disproportionately warmer nighttime and daytime air temperatures over developed versus natural land surfaces. The model represents how net radiation is partitioned between latent and sensible heat due to differences in weather, water availability, heat transfer properties, surface roughness, land surface geometry including urban canyons, and anthropogenic sources of heat. The i-Tree Cool Air model facilitates management by both forecasting heat maps with upcoming weather events or climate change and revealing mitigation to heat by simulating alternative scenarios with increased tree cover, water availability, or reduced impervious cover.
The required inputs include a time series of meteorological data and raster maps of elevation, tree cover, impervious cover, and land cover, typically provided by federal data sources such as National Land Cover Data (NLCD). The model also requires land cover parameters regulating the water and energy balance, such as leaf area index, soil hydraulic properties, and heat absorption and storage properties; default values for these parameters are provided based on NLCD classes.
The i-Tree Cool Air map pixel size determines the spatial resolution of the model simulation, with 10 to 300-meter resolutions proven to work well. The simulations are deterministic, spatially distributed, single event or continuous, and can run a one-day analysis in minutes to tens of minutes depending on city size and pixel resolution. The i-Tree Cool Air output options include air temperature maps, time series and statistics including maximum temperatures, heat indices and wind chill, along with water and energy balances.
The model uses the census block group maps, or equivalent maps, to statistically organize some outputs by neighborhoods. The i-Tree Cool Air model was initially developed by Professor T. Endreny and his PhD student Y. Yang under the name PASATH, an acronym for Physically-based Analytical Spatial Air Temperature and Humidity, as explained in Yang et al. (2013).

NUCFAC Simulations
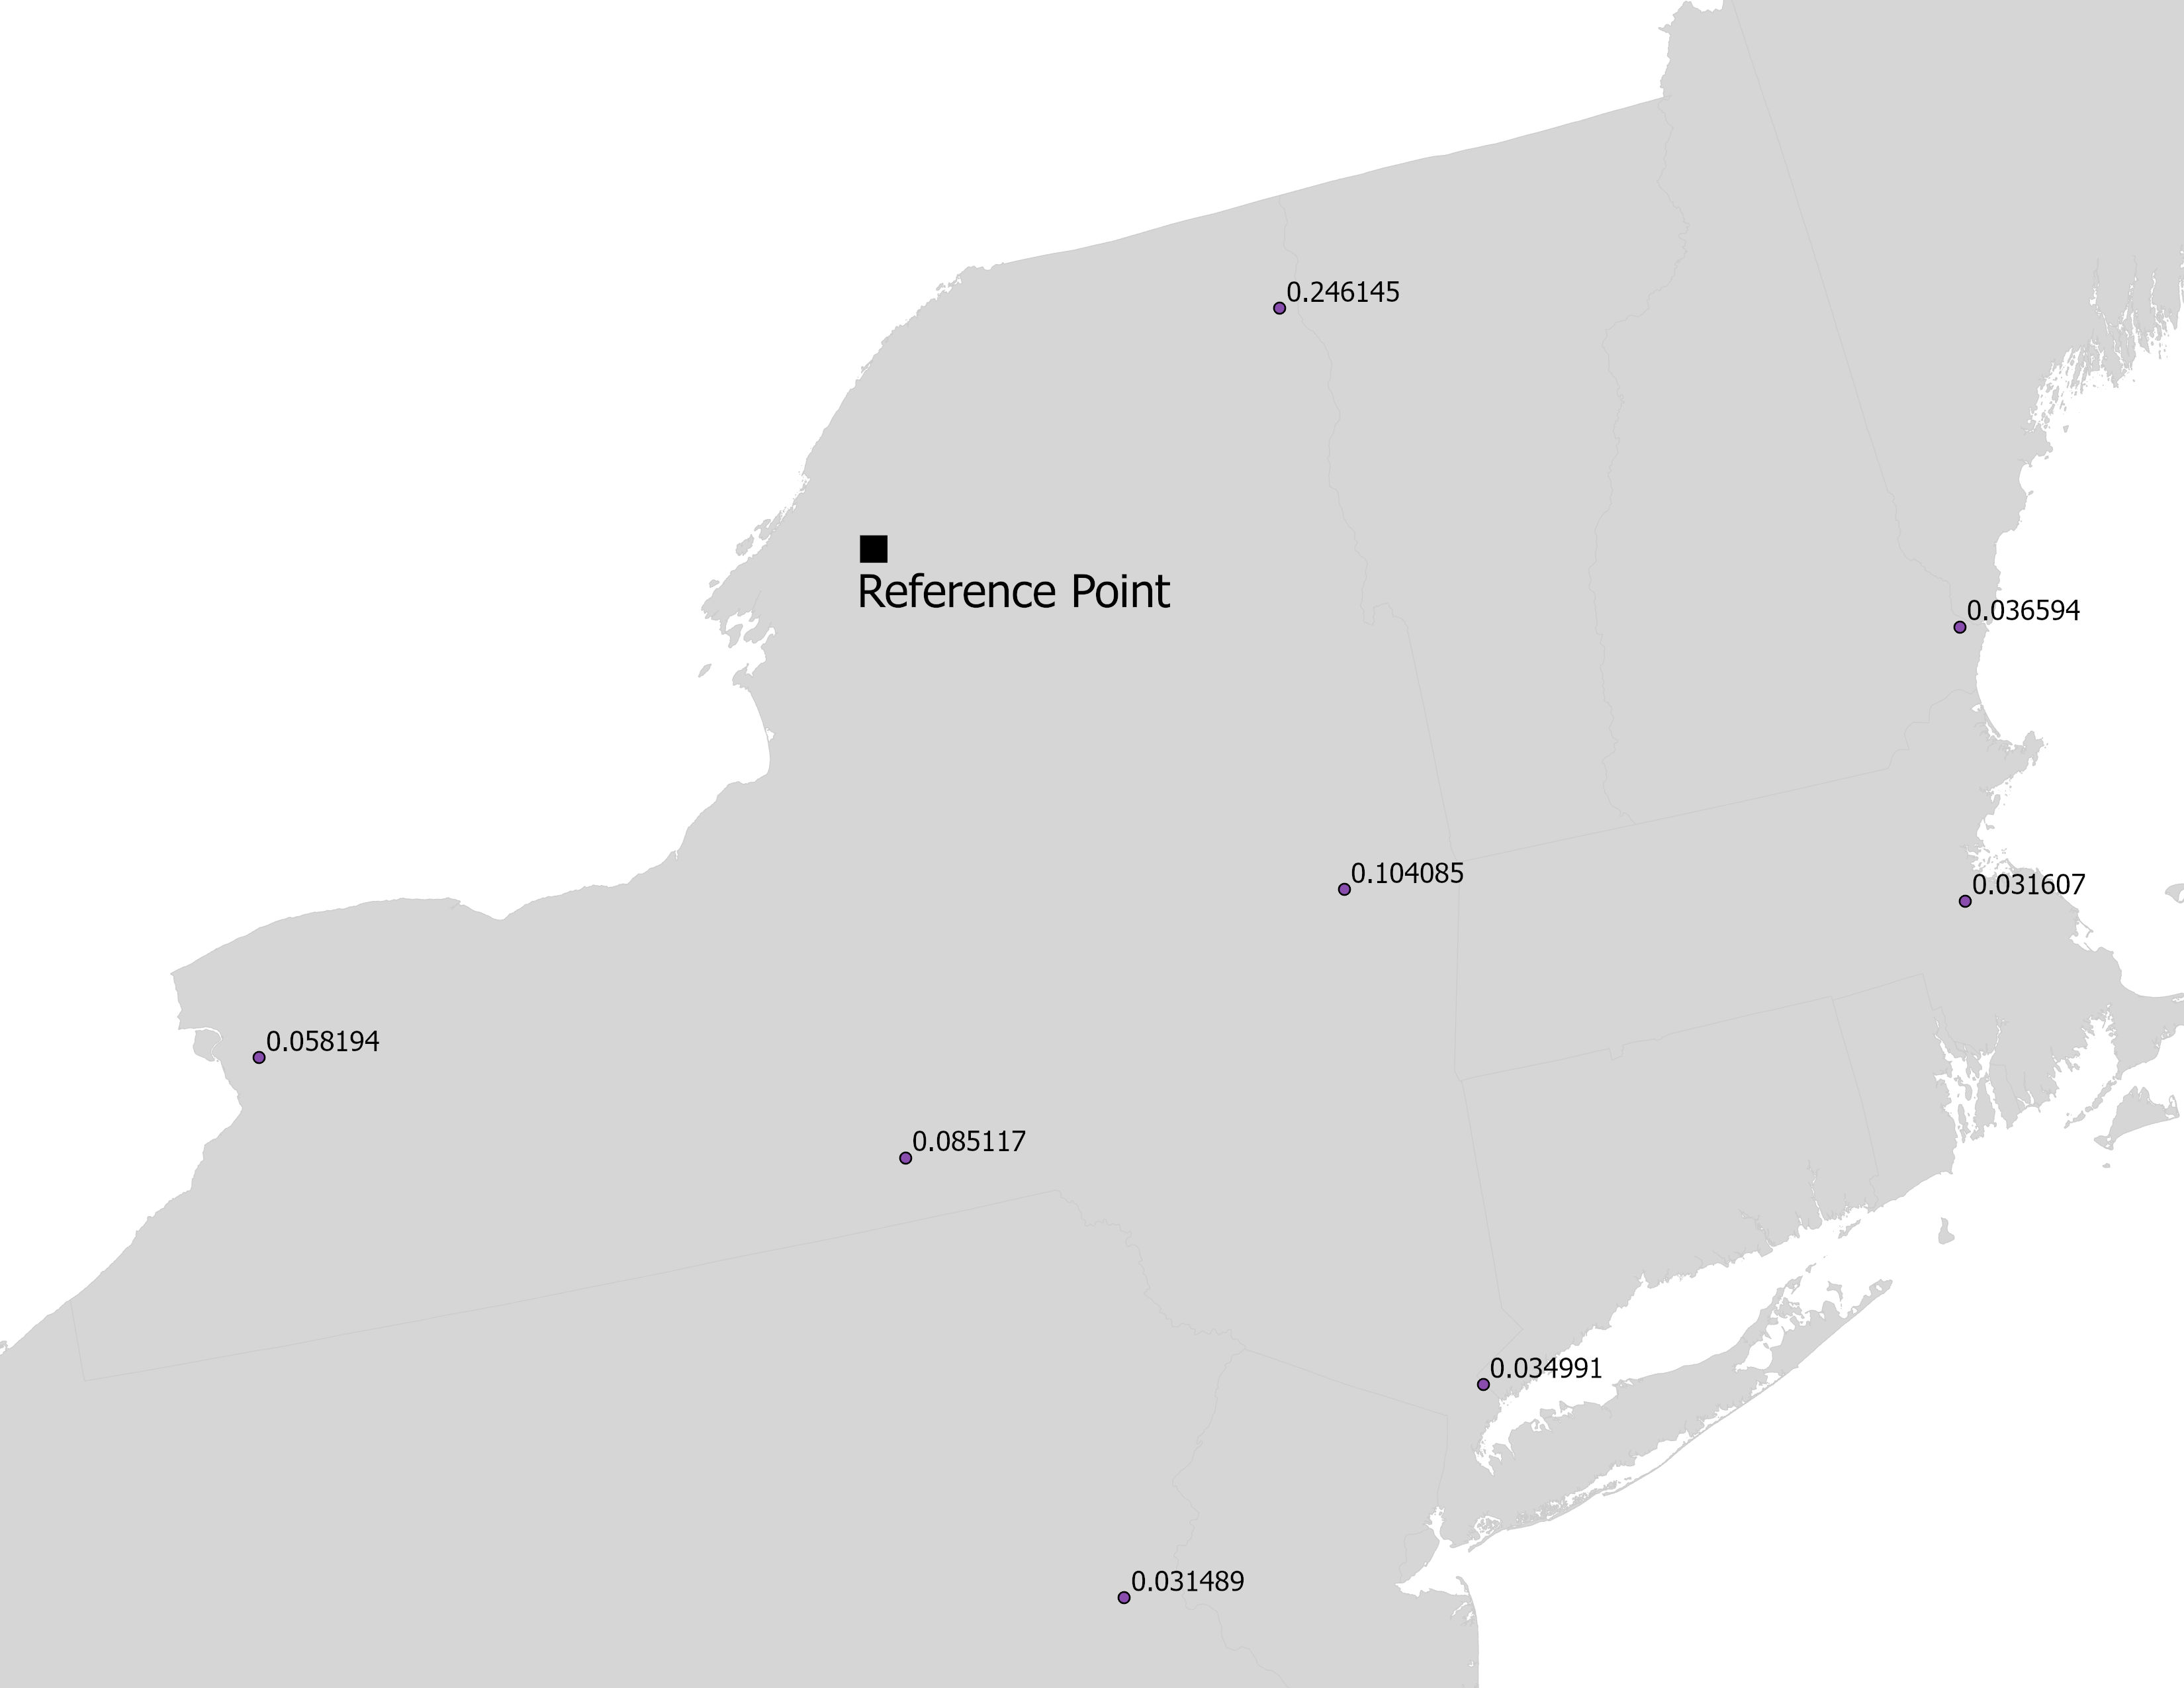
For this project, the hottest day from 2021 was chosen across 122 weather stations in the continental United States. These weather stations represent National Weather Service boundaries used for forecasting. Simulations were broken up by state, and further broken down by quadrants due to memory restrictions. For each cell, all 122 weather stations were weighted to a total of one, with the three closest stations tending to have the largest impact >0.1. Changing from one weather station to a weighting of all sampled stations was done to ensure a uniform national product while preserving the morphologies of the urban heat island effect across the country. The average change in temperature from this methodology was +/- 0.5 Kelvin.
The NLCD land cover and impervious cover products from 2019 were used, along with 2016 NLCD tree canopy cover. Elevation data was retrieved from NHDPlus Version 2.
All simulations were done at a 300m resolution for a duration of 10 hours to ensure proper calculations of solar radiation for the day. Each state was individually processed, combined into a nationwide raster, and then merged with census data to enable further analyses.
This report is meant to be a static product to provide examples of i-Tree Cool Air outputs and their utility in land use and planning. As a nationwide report, this represents a small subsect of possible analyses, with much larger possibilities analyzing heat and population on a community or state-wide level. Incorporation with census data can help identify disadvantaged communities that would benefit the most from tree planting or other heat mitigation scenarios.
Metadata
HydroPlus revision: 1240
i-Tree Cool Air model may underestimate maximum air temperature on mountaintops due to the use of algorithms with simplifying assumptions for adiabatic cooling with dry and wet lapse rates. To remove this potential bias, a minimum air temperature of 50 F was established, and any estimated temperatures below this minimum were mapped as 50 F. The 50 F threshold minimum was selected based on analyzing the model predicted hottest hour air temperature and the observed air temperature (July 28, 2021 at 3 pm) for weather station ID 720385-00419 at 4000 m elevation. For this site, the model estimate was based adiabatic cooling of the reference station air temperature from weather station ID 725640-24018.
View HydroPlusConfig.xml
Download Weather Station Metadata (CSV)