Evaluating Urban Canopy's Role in Alleviating Extreme Heat: An i-Tree Cool Air Analysis
West Region
The West region comprises Arizona, California, Colorado, Idaho, Montana, Nevada, New Mexico, Oregon, Utah, Washington and Wyoming. To view a subregion, select your area of interest on the map below:
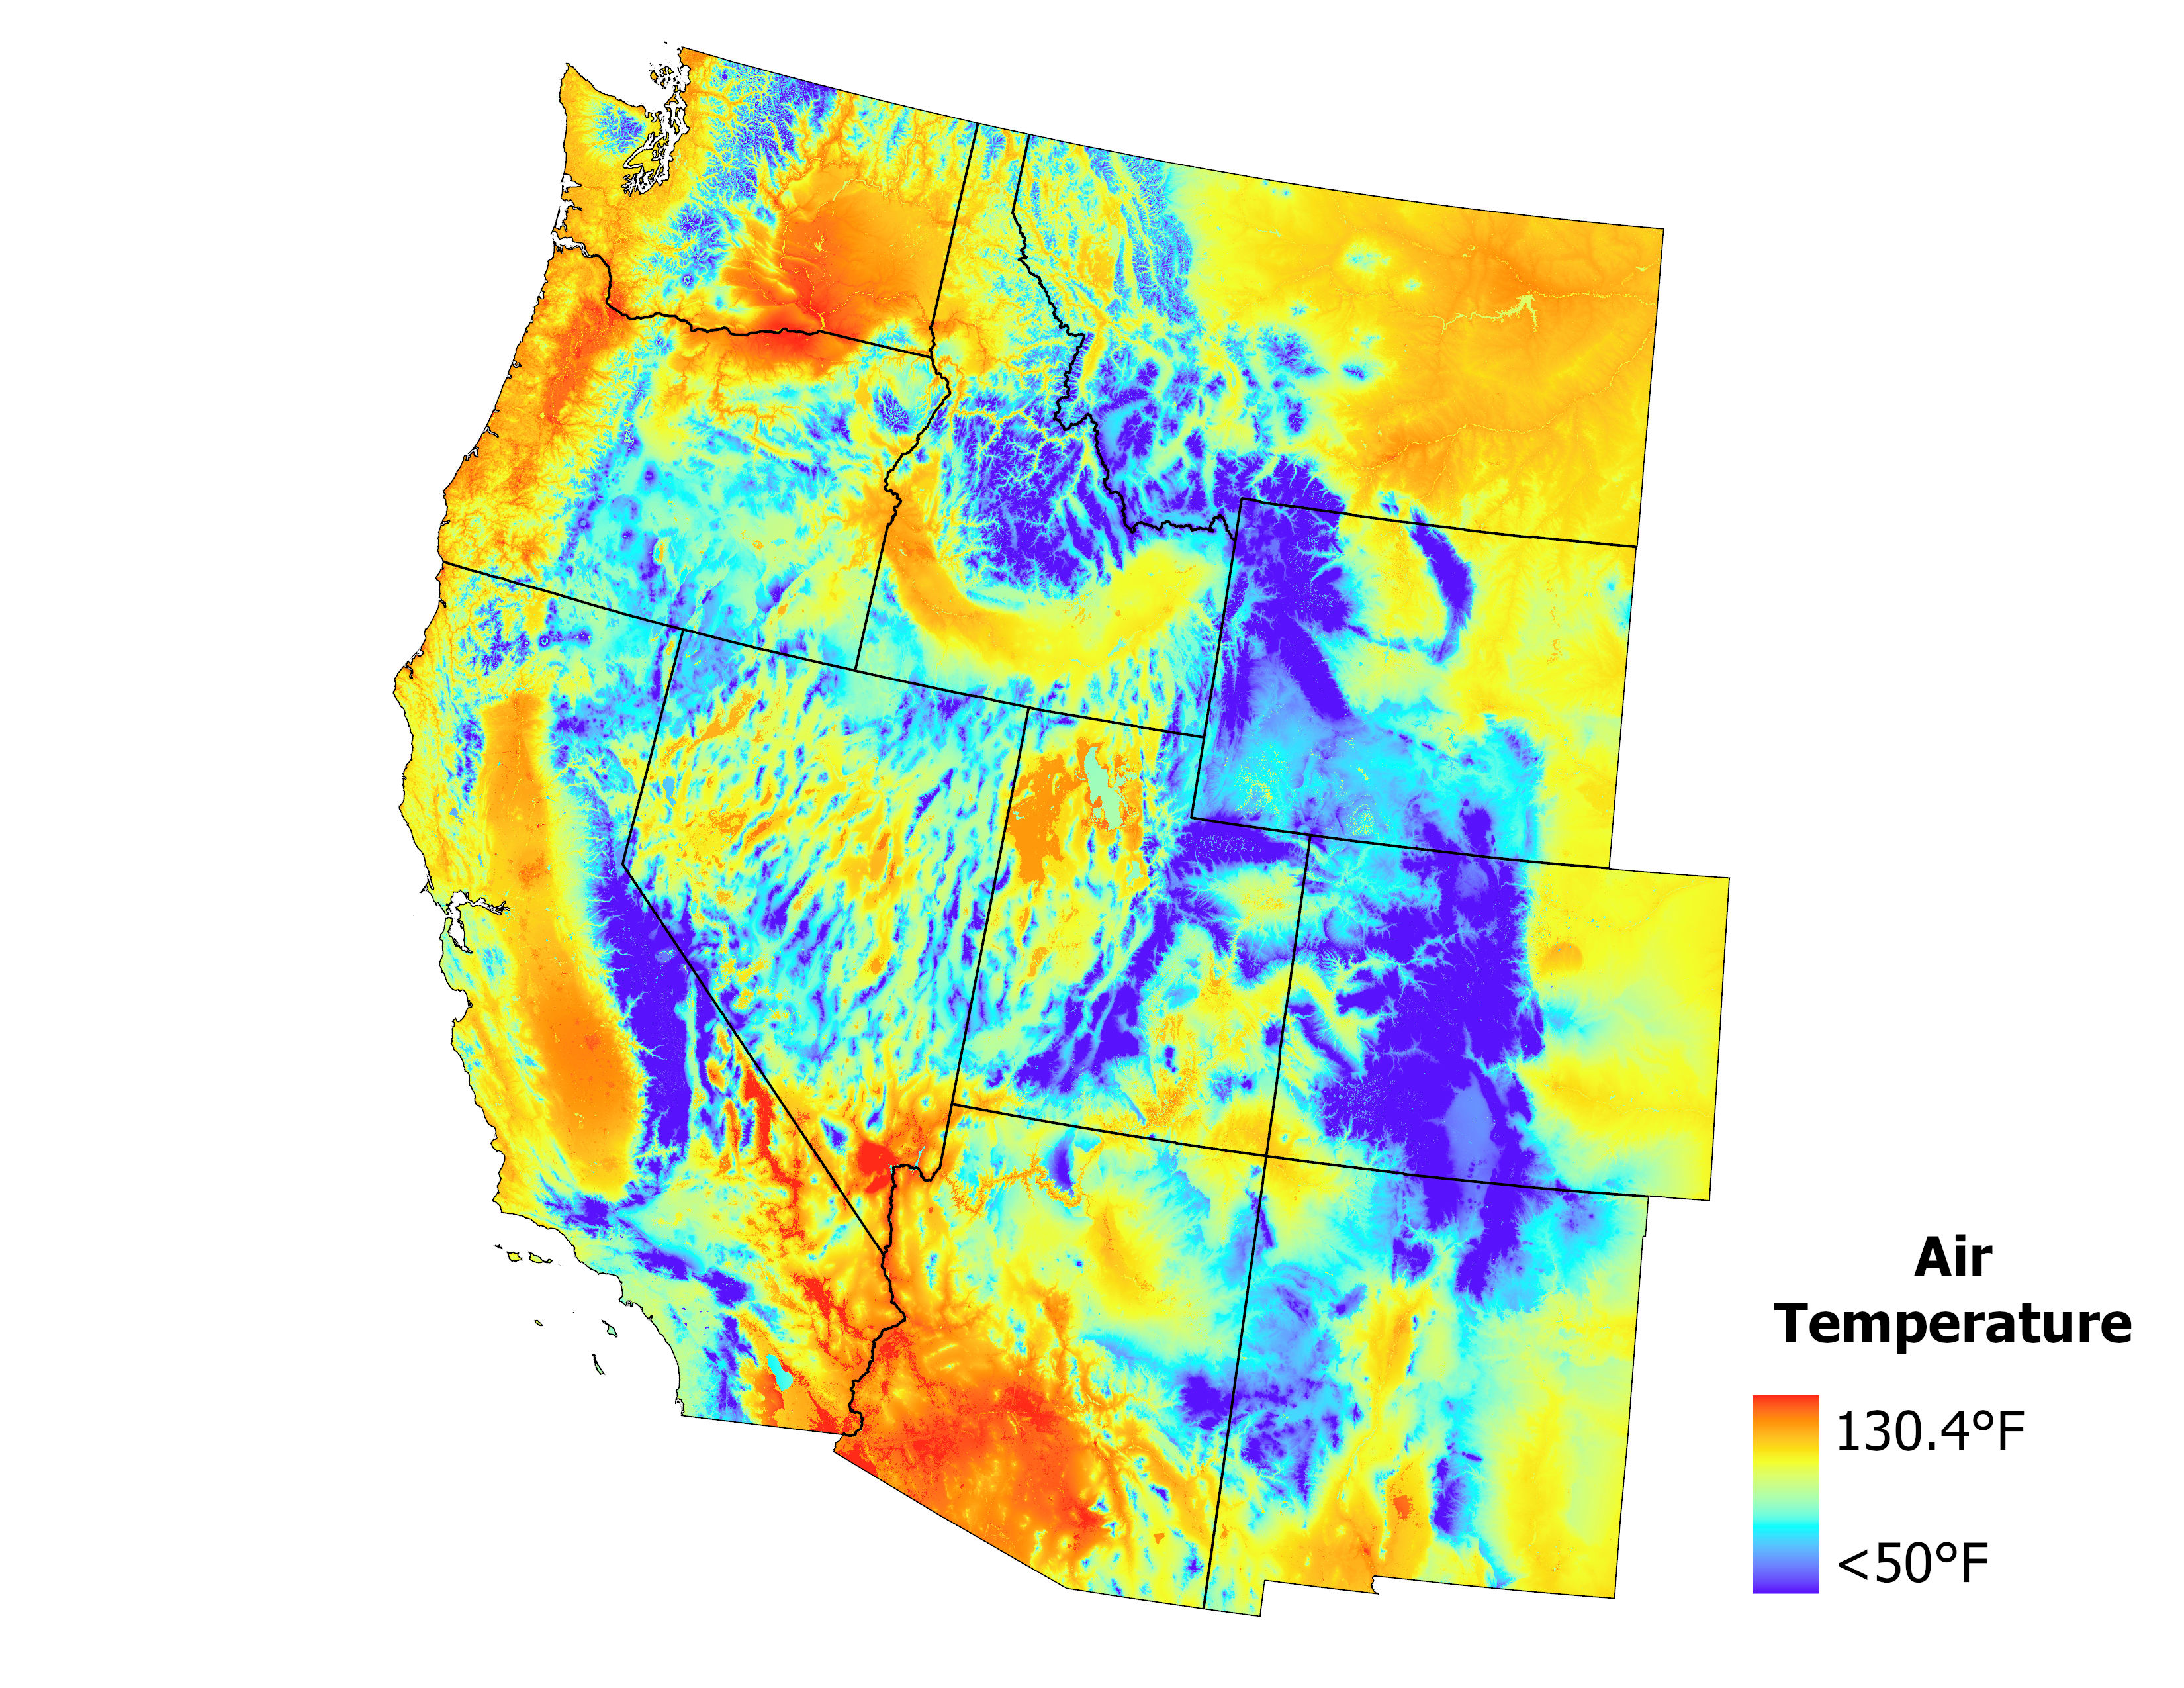
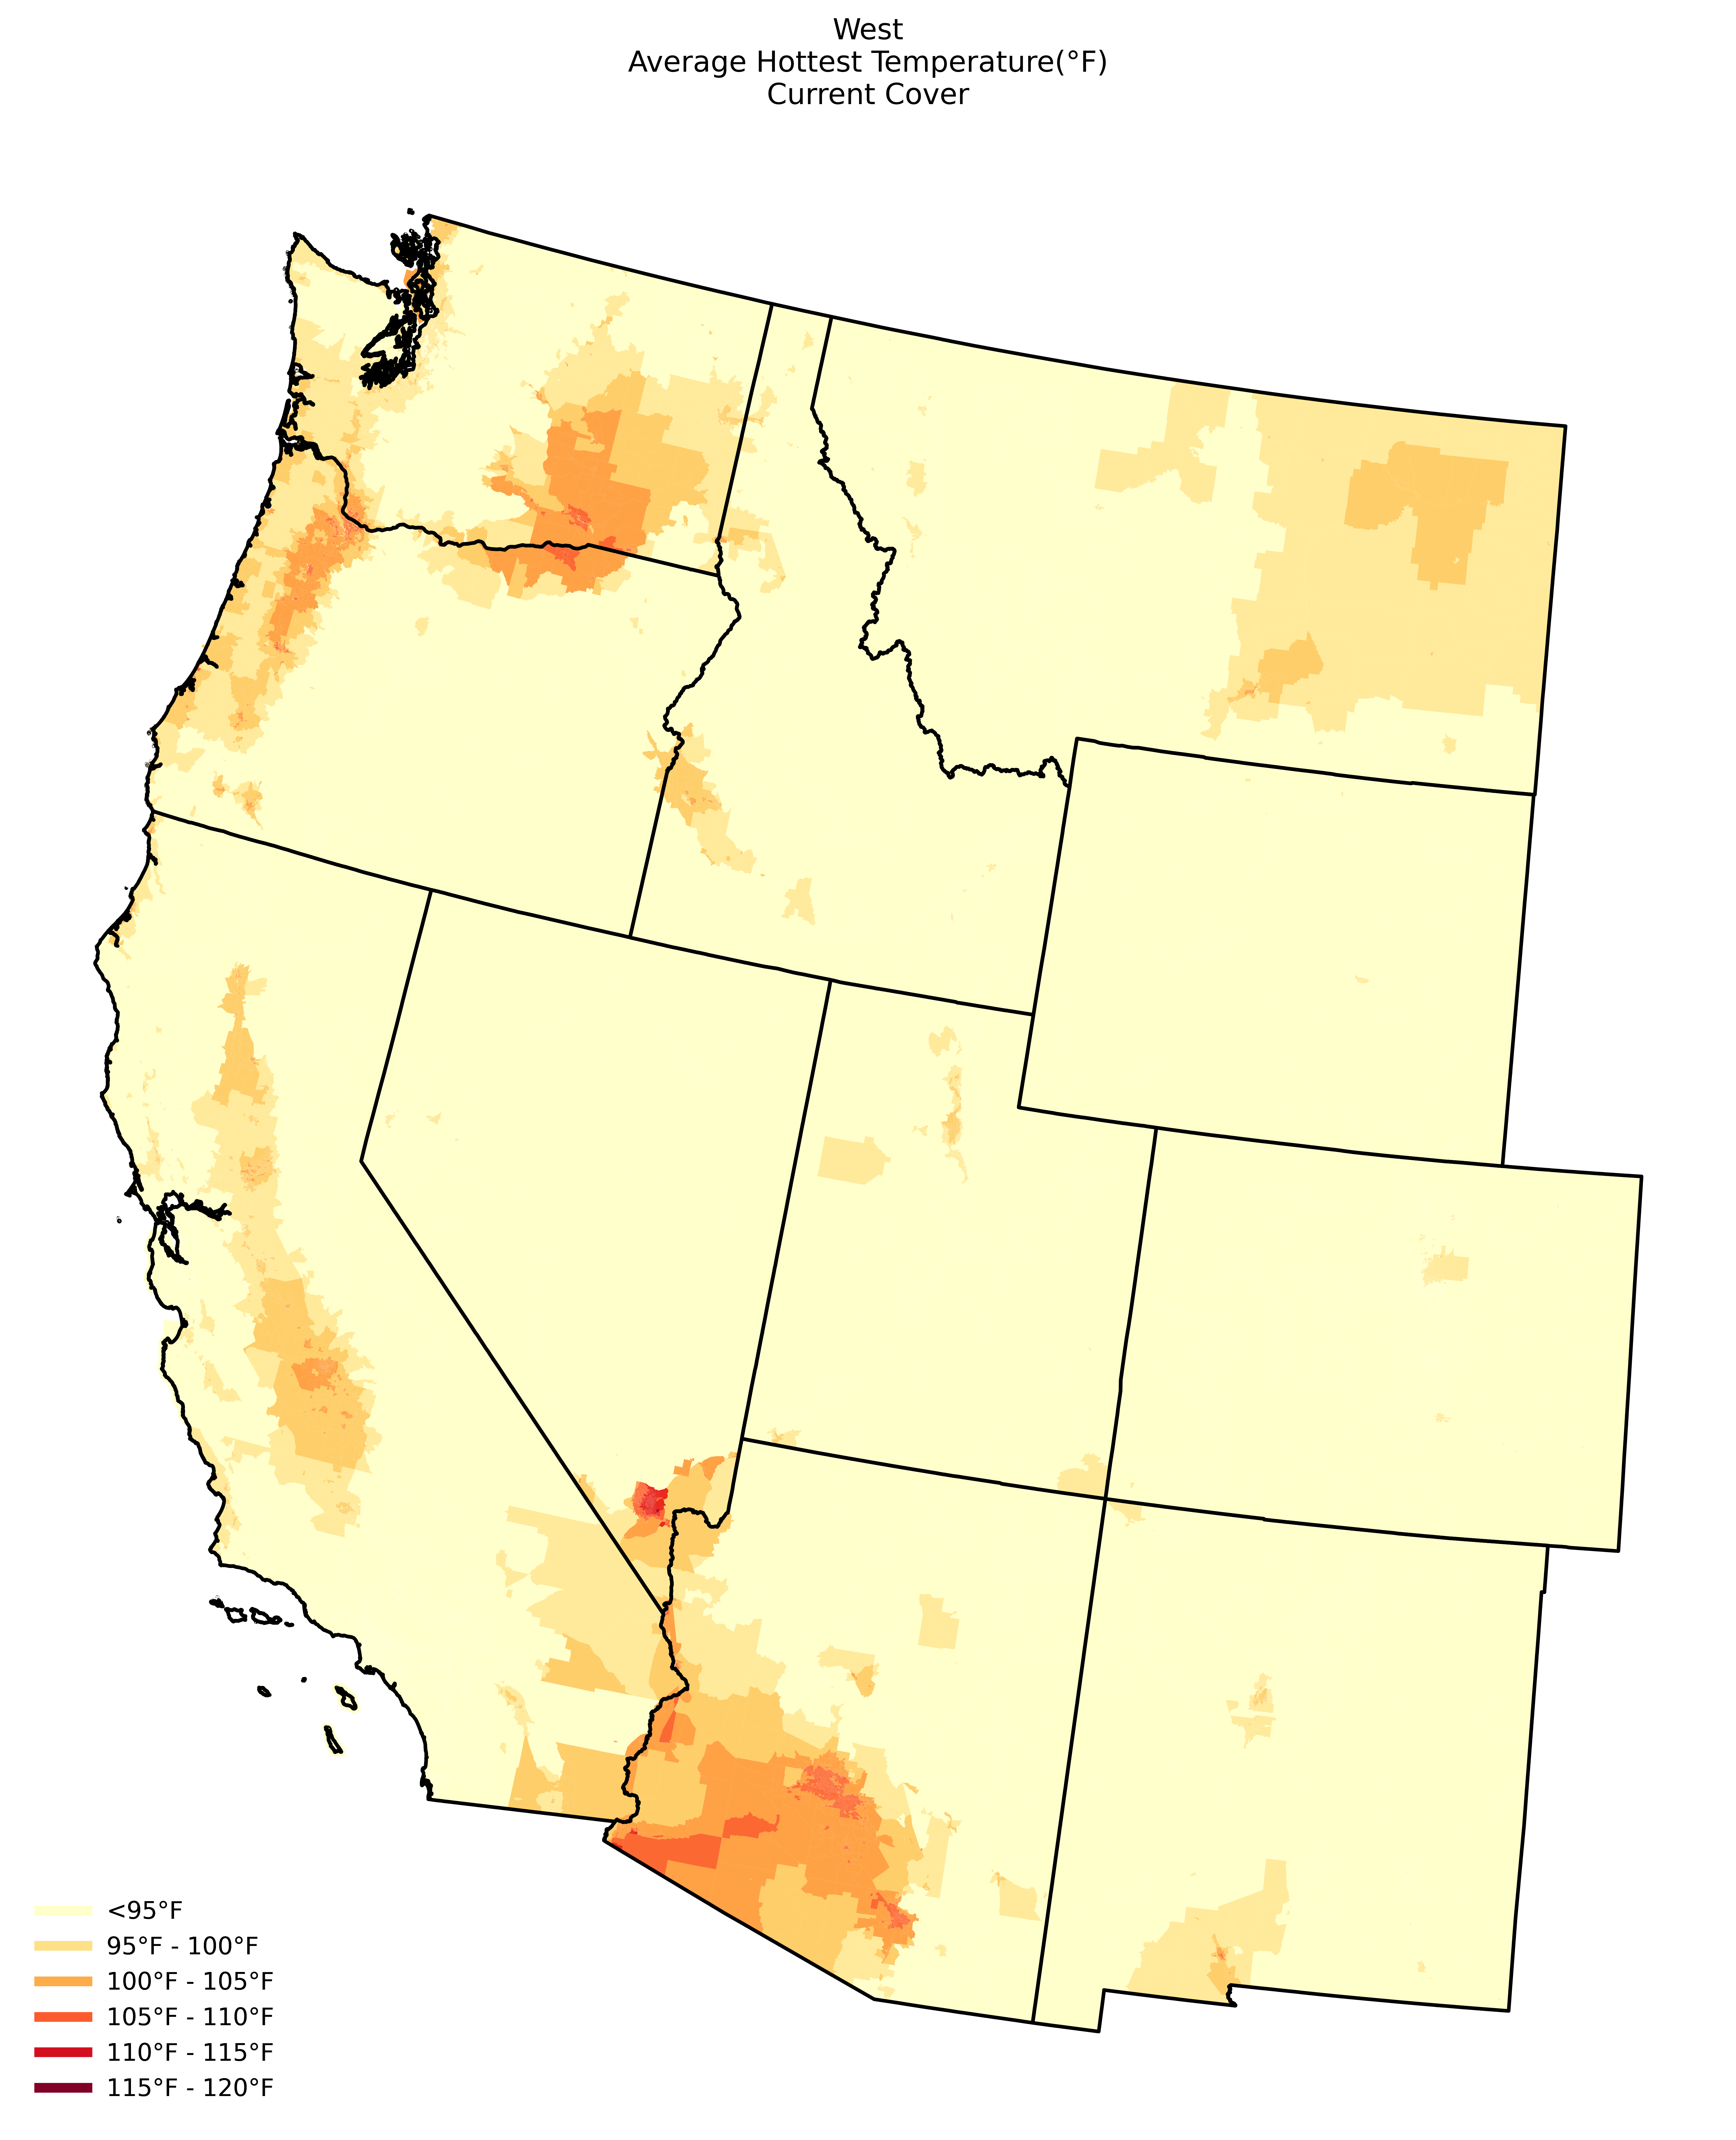
Air Temperature
Using i-Tree Cool Air, the hottest day across the study area was simulated at a 300m raster resolution. These runs were combined to create a map representing the hottest air temperature reached throughout the region.
| Attribute | Degrees (°F) |
|---|---|
| Average Maximum Temperature | 93.0 |
| 90th Percentile Maximum Temperature | 110.3 |
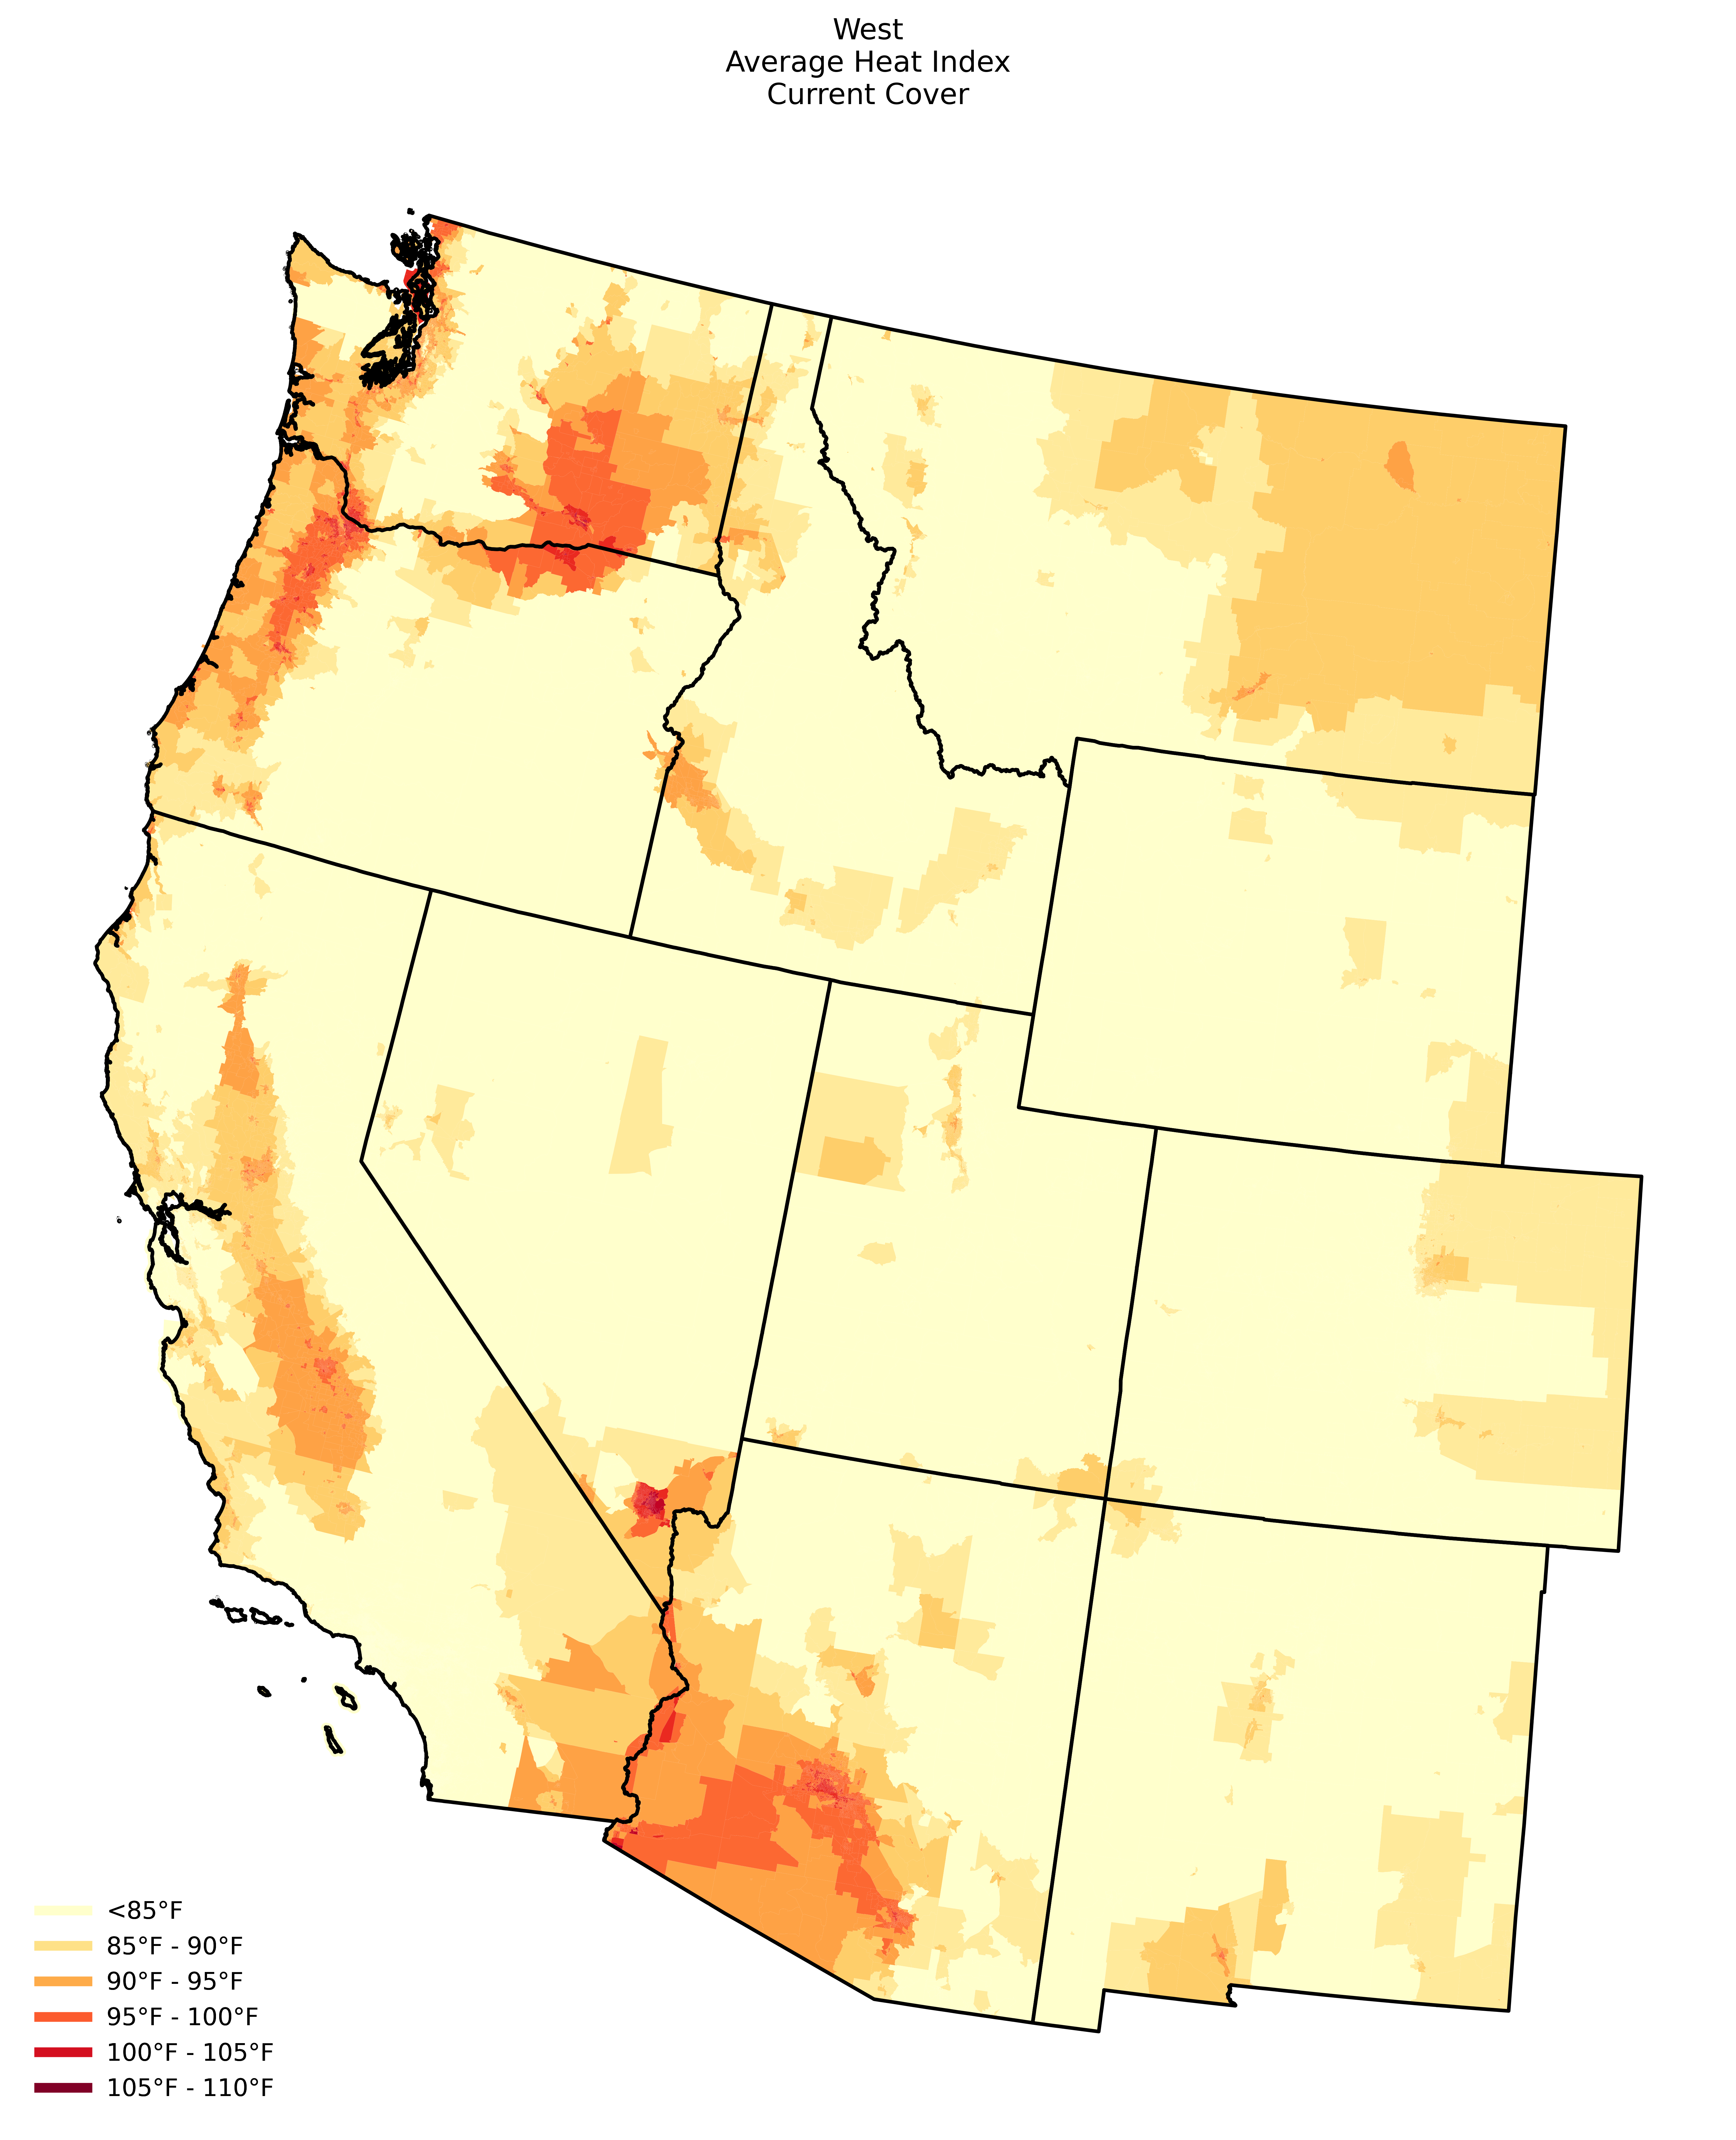
Heat Index
The average maximum heat index in 2021 is represented at the census block group level.
| Attribute | Degrees (°F) |
|---|---|
| Average Maximum Heat Index | 89.1 |
| 90th Percentile Maximum Heat Index | 104.2 |
Heat Index is defined as the apparent temperature in shaded areas based on the air temperature and relative humidity. Thresholds of heat index safety set by the National Weather Service (NWS) are as follows:
| Heat Index | Classification | Effect on the body with prolonged exposure/activity |
|---|---|---|
| 80-90°F | Caution | Fatigue possible |
| 90-103°F | Extreme Caution | Heat stroke, heat cramps, or heat exhaustion possible |
| 103-124°F | Danger | Heat cramps or heat exhaustion likely, and heat stroke possible |
| 125°F+ | Extreme Danger | Heat stroke highly likely |
Normalized Risk Scale
The normalized risk scale is between 0 and 1, based on the following formula:
- Risk = place value of air temperature / value of maximum US region value

Effects of Canopy on Extreme Heat
Canopy cover was adjusted for i-Tree Cool Air simulations to compare the Heat Index at -50% canopy cover to +50% canopy cover.
| Attribute | Temperature (°F) |
|---|---|
| -50% Canopy | 97.6 |
| +50% Canopy | 91.5 |
| Average temperature increase per 10% loss of canopy1 | +0.92 |
| Average temperature decrease per 10% gain of canopy1 | -0.3 |
1Where each pixel is a surface area of 90000m2, 1% is equal to 900m2 of canopy. For more information, see the Methodology section.
Select from a slider or GIF below to view how canopy cover affects temperature:

Effects of Impervious Cover on Extreme Heat
Impervious cover was adjusted for i-Tree Cool Air simulations to compare the Heat Index at -50% impervious cover to +50% impervious cover.
| Attribute | Temperature (°F) |
|---|---|
| +50% Impervious Cover | 103.3 |
| Average temperature increase per 10% gain of impervious cover1 | +2.06 |
1Where each pixel is a surface area of 90000m2, 1% is equal to 900m2 of impervious area. For more information, see the Methodology section.
Select from a slider or GIF below to view how impervious cover affects temperature:


Heat in Urban Areas
Census block groups within urban areas as defined by the United States census were isolated for a separate analysis. For a more in-depth look at urban heat, see the subregional report maps.
| Attribute | Value | Difference from National Urban Average |
|---|---|---|
| Average Temperature (°F) | 93.6 | -0.05 |
| Average Heat Index(°F) | 89.7 | -5.44 |
| Average temperature increase per 10% gain of impervious cover(°F) | +2.14 | +0.99 |
| Average temperature increase per 10% loss of canopy(°F) | +0.98 | +0.35 |
| Average temperature decrease per 10% gain of canopy(°F) | -0.3 | +0.02 |
| 90th percentile of temperature(°F) | 110.6 | 3.96 |
| Average canopy cover for +90th percentile of temperature (%) | 0.6 | -2.44 |